







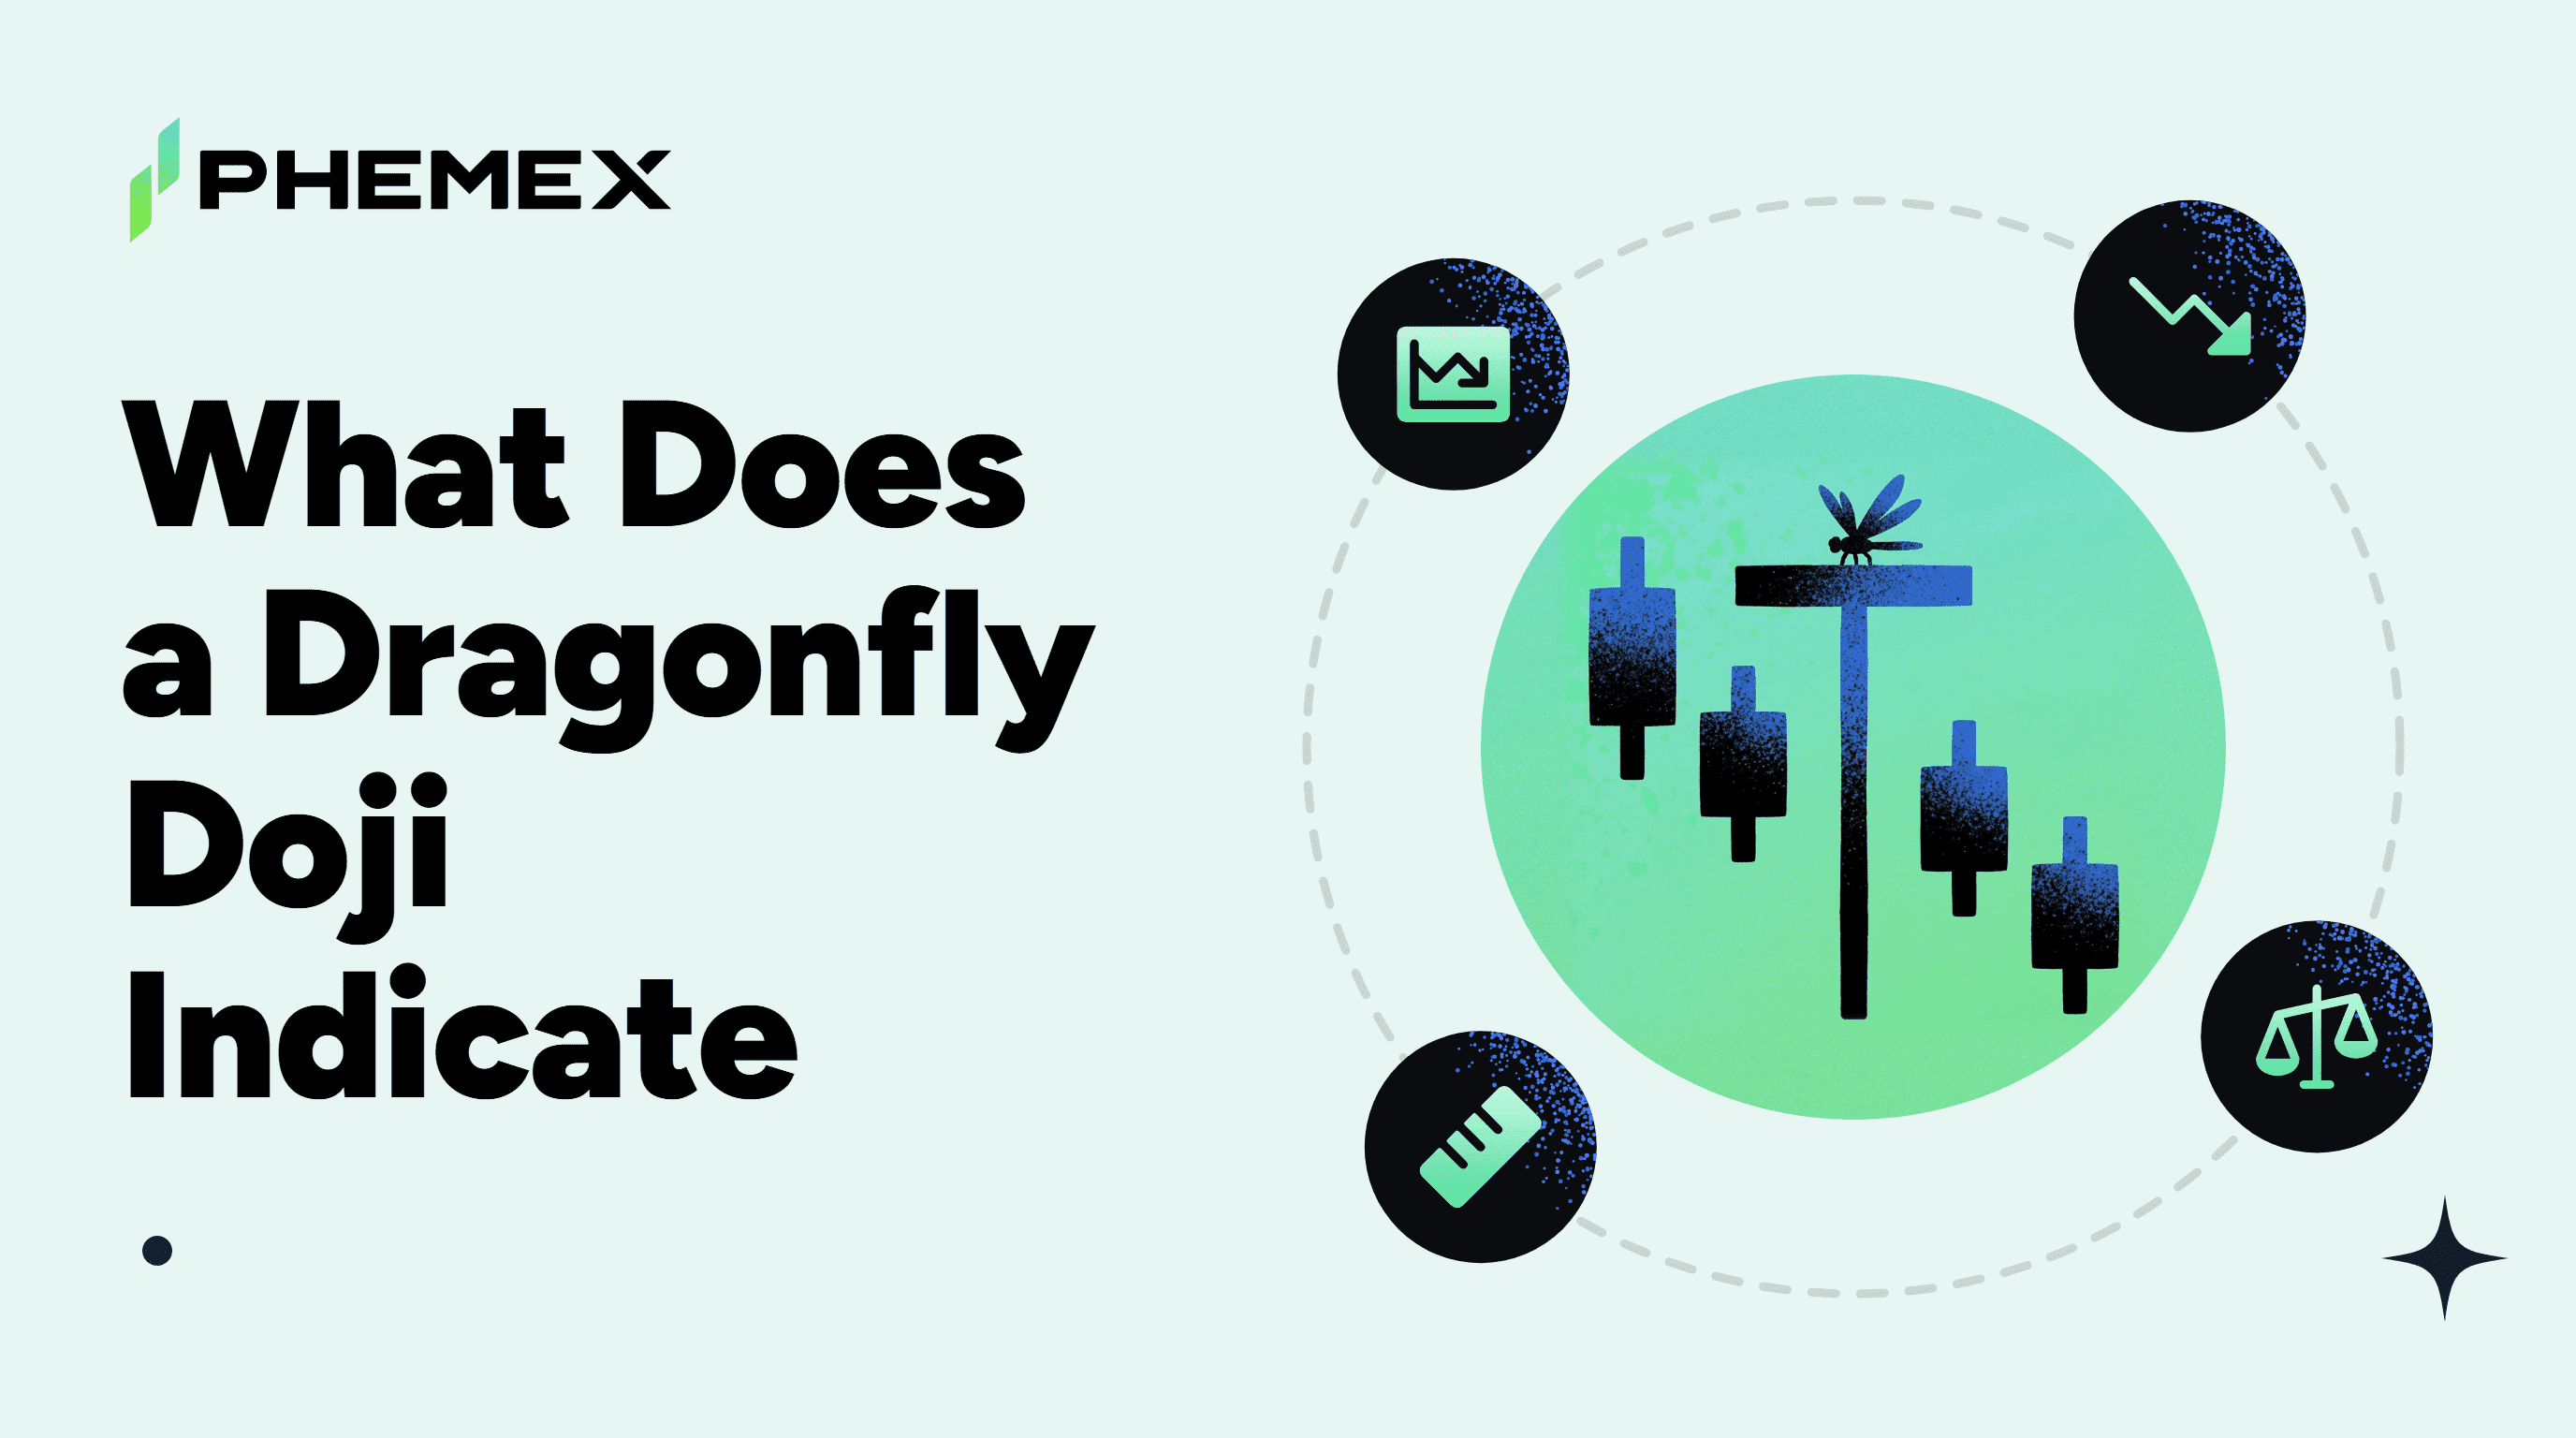
A dragonfly doji indicates that sellers drove the price well down in a session and buyers pushed it back to the open by the close, which traders read as bullish. It looks like a T, with the open, high and close bunched at the top of a long lower shadow.
On crypto daily charts that bullish reading mostly didn't hold, and it held least often where it should be strongest. Across 21 crypto perpetuals on Phemex from February 2024 to the mid-November close, 28 of 93 dragonfly dojis closed higher ten days later, against 43.9% of all days. After a fall of 10% or more, only 5 of 25 did, against 49.0% of all such days.
Is a Dragonfly Doji Bullish or Bearish?
By reputation it's bullish, and on these charts it behaved more like a bearish candle. StockCharts' ChartSchool says a dragonfly normally appears at market turning points. The long lower shadow is why traders lean bullish, because buyers took back every lower price the sellers reached that day.
What came next told a different story. Across those 93 dragonflies, the median move over the following ten days was about -4.1%, against -1.7% for all days in the same markets. So the typical dragonfly was followed by a deeper slide than an ordinary day was.
The record wasn't even across the years, and that's the strongest case for the other side. In 2024 more than half the dragonflies were higher ten days later, beating the rate for all that year's days. In 2025 only 11 of 53 were, against 44% of all 2025 days.
Still, we'd read a dragonfly as a pause in a fall until the price proves otherwise. It's history from one stretch of crypto trading and no promise about the next candle you see.
What Does a Dragonfly Doji Look Like?
A dragonfly doji candlestick has almost no body and almost no upper shadow, so everything happens at the top and a long tail hangs below. A marubozu candle is the opposite, nearly all body with little or no shadow.
The meaning of a dragonfly doji comes from that tail. Sellers pushed the price far under the open during the session, and buyers lifted it all the way back before the close.
Real candles rarely open and close at exactly the same price, so any count needs a tolerance. Ours counted a candle as a dragonfly when its body and its upper shadow were each no more than a tenth of the day's range. There's no official setting for this, so a stricter or looser line would catch a different set of candles.
Turn the shape upside down and you get its mirror image, the gravestone doji that traders read as a bearish reversalwhen it prints at the top of an uptrend.
|
Signal
|
What it tells you
|
BTC on Phemex
|
|
Body at the top
|
Open and close almost equal, near the high
|
28 Feb 2025: open 84,670.3, close 84,302.9
|
|
Long lower shadow
|
Sellers pushed far down, buyers took it back
|
High 85,094.3, low 78,227.0
|
|
Where it formed
|
After a fall, at a low
|
After an 11.6% fall over ten days, at a 20-day low
|
|
Confirmation
|
The next candle closes above it
|
1 Mar 2025 closed at 86,016.2
|
|
Ten days later
|
A higher close means it held
|
10 Mar 2025 closed at 78,565.8, 6.8% under it
|
|
BTC's record
|
5 dragonflies, February 2024 to mid-November
|
1 of 5 higher at ten days, against 49.9% of all BTC days
|
Where Is a Dragonfly Doji Typically Formed?
Chart guides place it after a fall, at or near a fresh low, where a turn would matter most.
That's the case the bullish reading rests on, so the table below checks it directly.
The table splits the 93 dragonflies by what came before them. A fall means the close before the candle was under the close ten days earlier. A new 20-day low means the candle dipped under every low of the 19 days before it.
Every share in the table sits beside its base, all days in the same markets with the same setting. That matters because the period leaned down. An ordinary day here was followed by a higher close ten days later less than half the time, so 50% is the wrong yardstick.
|
Setting (ten days on unless noted)
|
Dragonflies higher
|
All days, same setting
|
|
Every dragonfly
|
28 of 93 (30.1%)
|
43.9%
|
|
After a 10-day fall
|
16 of 61 (26.2%)
|
46.0%
|
|
After a fall of 10% or more
|
5 of 25 (20.0%)
|
49.0%
|
|
At a new 20-day low
|
9 of 37 (24.3%)
|
49.1%
|
|
After a 10-day rise
|
12 of 32 (37.5%)
|
41.2%
|
|
Confirmed by the next close, 20 days on
|
15 of 35 (42.9%)
|
40.9%
|
|
Confirmed at a 20-day low, 20 days on
|
7 of 13 (53.8%)
|
47.0%
|
The deeper the fall before the dragonfly, the worse it did. Waiting longer didn't rescue it either. Five days on, 29% were higher against about 45% of all days, and at 20 days it was 31% against about 42%.
The only settings that edged past their base needed a higher next close and a full 20 days. They rested on 35 cases, and on 13 at a fresh low, which is too few to lean on.
If you'd rather have the confirmation built in, the three inside up pattern adds a confirming third candle to its own setup.
Can a Dragonfly Doji Be Bearish?
Yes, and the record leaned that way after rises as well as after falls. When the price had climbed over the ten days before, 20 of 32 dragonflies were not higher ten days later, about 63% against 59% of all after-rise days.
Bitcoin's dragonfly of late February 2025 shows how a textbook setup can fail. It printed after a fall of nearly 12% and at a 20-day low, and the next day closed above it, the confirmation chart guides ask for. Ten days later Bitcoin had closed nearly 7% under the dragonfly's close.
It was one of five Bitcoin dragonflies in the period, and only the one from late September 2025 was higher ten days later, by about 11%.
Can a Dragonfly Doji Be Red?
Yes. A textbook dragonfly opens and closes at the same price, so it has no color, but real candles rarely match to the cent. Of the 94 dragonflies the count found, 42 closed a little below their open and printed red, and one opened and closed at exactly the same price.
Color made almost no difference. Leaving out one candle too recent for a ten-day result, 13 of 41 red ones and 15 of 51 green ones were higher ten days later, nearly the same share.
So we wouldn't read anything into the color of a dragonfly. What came before it told you more than the shade of its tiny body.
Dragonfly Doji vs Hanging Man
The two look alike, and the differences decide how you read them. In StockCharts' dictionary a hanging man has a real body near the top of a long lower shadow, like a square lollipop on a stick. It only takes that name when it forms during an advance, while a dragonfly has almost no body and can print anywhere.
So a dragonfly that follows a climb sits in a hanging man's spot, where chart readers watch for a top. The after-rise row above is that case, and it leaned bearish by only a few points against an ordinary day.
Both need the next candle to confirm them. A hanging man wants a lower close, and a bullish dragonfly wants a higher one, so the next session tells you which story the market picked.
How Can You Spot a Dragonfly Doji on Phemex Charts?
You can check every step below on the BTC/USDT futures chart, the market behind the Bitcoin case above.
-
Open the BTC/USDT futures page on Phemex, stay on the Chart tab and pick D for daily candles, the timeframe this record covers.
-
Look for a candle with no visible body at its top and a long lower shadow. Point at it and the line above the chart shows the candle's four prices.
-
Check the body and the upper shadow against the day's full range. Each should be no bigger than about a tenth of it.
-
Look back ten days to see if it came after a fall or a rise, and check if its low undercut every low of the 19 days before.
-
Wait for the next daily close. A close above the dragonfly is the textbook confirmation, though in this record even confirmed signals trailed their base at ten days.
-
If you trade it, set a stop-loss order under the dragonfly's low with the order form's TP/SL option.
The stop has a quirk. Within ten days, 63 of 93 dragonflies traded below their own low against 82% of all days, a gap that isn't like for like because a dragonfly's low lies at the end of an unusually long shadow. A stop under it starts further from the price than a stop under an ordinary day's low.
Futures use leverage, and a leveraged position is closed automatically if losses push its margin below a set minimum. The order form shows an estimated liquidation price before you open, and it pays to know how liquidation in crypto trading works and how to avoid it before you size a trade.
Frequently Asked Questions
Is a dragonfly doji the same as a hammer?
No. StockCharts describes a hammer as a candle with a real body near its top that forms during a decline. A dragonfly's open and close are at the high with almost no body, so a dragonfly after a fall looks like a hammer that lost its body.
Does a longer dragonfly doji work better?
Not in this record. The 51 dragonflies whose range matched or beat the average of the ten days before were higher ten days later 13 times, about a quarter. The shorter ones did a little better at 15 of 42, and both trailed the 44% of all days.
How long does a dragonfly doji signal last?
The bullish reading trailed an ordinary day at every wait on these crypto charts. Whatever the wait from five days to 20, roughly 3 in 10 dragonflies were higher against 42% to 45% of all days over the same spans.
Bottom Line
A dragonfly doji shows that buyers won one session, and on crypto daily charts one session usually wasn't enough. The long shadow that makes it look bullish also shows how far sellers could push in a single day, and after a sharp fall or at a fresh low they usually pushed again.
We'd treat it as the start of a question and let the next few closes answer it before putting money behind the turn.
Disclaimer: This article is for informational purposes only and is not financial advice. Cryptocurrency trading involves substantial risk. Always do your own research before making investment decisions.
