










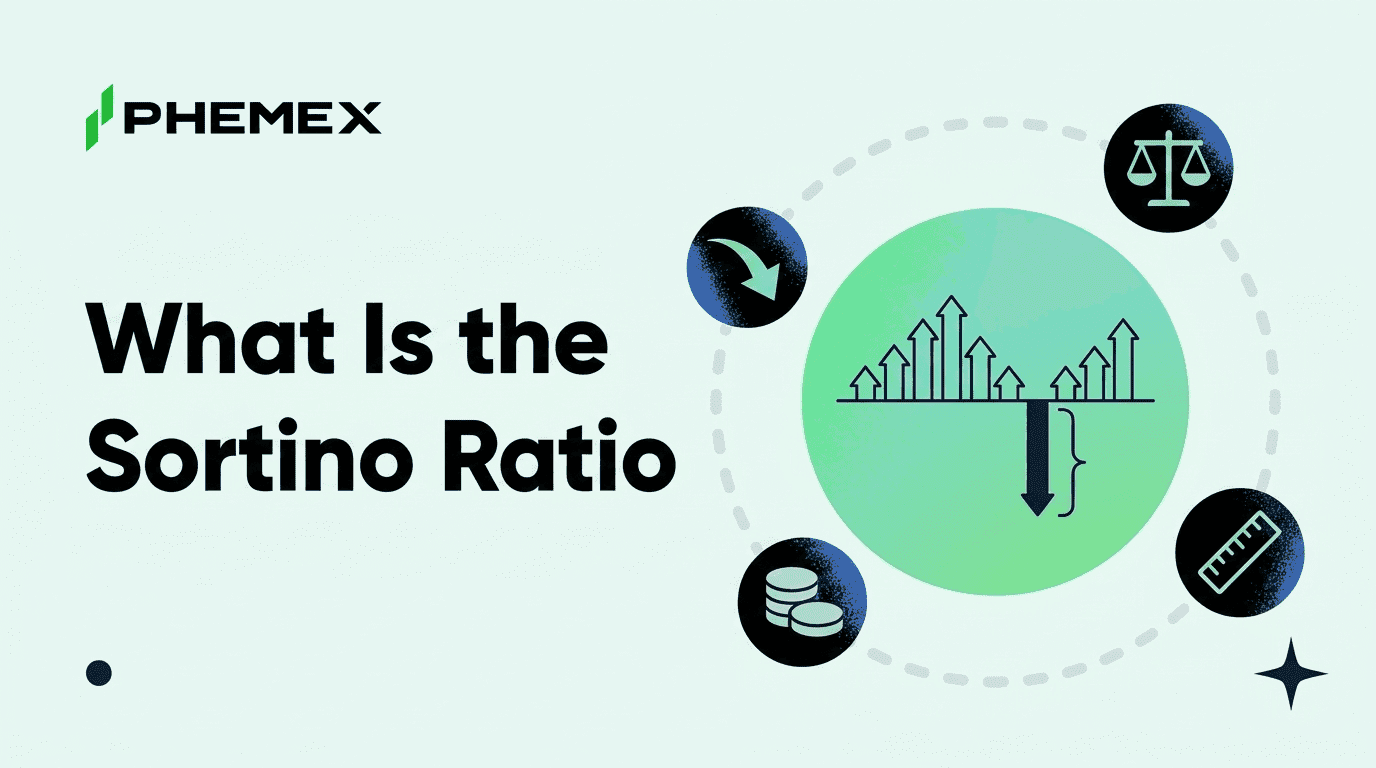
The Sortino ratio measures return per unit of downside risk. It takes your average return above a target, then divides that by the deviation of only the returns which fell below the target. Winning periods are ignored in the denominator entirely. One number, and it treats a rally and a drawdown as two different events rather than one.
Think of it as a driving instructor with a clipboard. Standard deviation is the instructor who deducts a point every time the speedometer moves off the average, so accelerating costs you exactly what braking costs you. Downside deviation is the instructor who only marks the braking.
The Sortino Ratio at a Glance
|
Metric
|
Details
|
|
One-line definition
|
Excess return above a chosen target, divided by the deviation of the returns that fell below that target
|
|
Formula
|
(Rp minus target) divided by downside deviation, where downside deviation is the square root of the sum of min(0, r_i minus target) squared, divided by n
|
|
What it is used for
|
Ranking strategies, funds and copy-trading leaders when the return series is skewed, and separating upside volatility from real losses
|
|
What it cannot tell you
|
Anything reliable at low sample counts. The denominator is built from losing periods only, so a set with one loser produces a tiny divisor and an inflated ratio
|
|
Where it appears on a chart
|
Nowhere on a price chart. It is a performance statistic read from a return series, shown in strategy, backtest and copy-trading performance panels rather than drawn as an overlay
|
|
Most common misreading
|
Treating the raw figure as a quality score. A Sortino ratio scales inversely with how many losing periods a set contains, so it is comparable only against another Sortino ratio built on the same target, the same period length and a similar sample size
|
On Saturday 5 September 2026, twenty of the twenty-one crypto assets on the Phemex daily tape closed higher. ARB ran +34.45%, UNI added +13.78%, and BTC barely moved at +0.21%. One asset fell, LIT, by 1.39%. Feed those 21 closes into the two most-used risk-adjusted return metrics and the Sharpe form prints 0.643 while the Sortino form prints 15.668, on numbers that are identical in every other respect.
That gap isn't a rounding artifact or a quirk of one dataset. It's what the two formulas are built to do, and once you've seen it on real closes you stop reading either number the same way.
What Does the Sortino Ratio Measure That Sharpe Does Not?
Both ratios share a numerator. You take the return of the thing you're measuring, subtract a target, and you have excess return. The argument is entirely about the denominator, and the two formulas answer it very differently.
The Sharpe ratio divides by total standard deviation. Every deviation from the mean counts, in both directions, with equal weight. A session where you were up 34% and a session where you were down 34% contribute the same amount of punishment to your score. If you've ever wondered why a strategy that only ever gapped upward scored badly on a risk-adjusted basis, that's the mechanism, and we walked through it in the case against the Sharpe ratio.
Sortino swaps that denominator out. It computes downside deviation instead, which squares only the returns below your target, sums them, divides by the full period count n, and takes the square root. Upside sessions still count in the numerator, where they help you. They contribute exactly zero to the denominator, by design.
Note the divisor there. You divide by n, the total number of periods, not by the number of losing ones. That choice is deliberate, and it stops a strategy with two losses in a hundred being scored on the same footing as a strategy with fifty. It's also, as you'll see below, where the metric gets fragile.
The practical read is simple enough to keep in your head. Sharpe asks how bumpy the ride was. Sortino asks how much of the bumpiness hurt you.
How Do You Calculate the Sortino Ratio on Real Numbers?
The desk ran it across the whole 5 September crypto board, using each asset's completed daily close as one observation and a target of zero. Twenty-one assets, twenty-one returns, one target, two ratios.
|
Input
|
Value
|
|
Observations
|
21 daily closes, Saturday 5 September 2026, Phemex spot
|
|
Mean return
|
+4.7524%
|
|
Population standard deviation
|
7.3885
|
|
Returns below the zero target
|
1, LIT at −1.39%
|
|
Downside deviation
|
0.3033
|
|
Sharpe form, mean divided by standard deviation
|
0.643
|
|
Sortino form, mean divided by downside deviation
|
15.668
|
A 24.36x spread, from swapping one term. Two things are doing that work. LIT's loss is small in absolute size, so squaring it makes it smaller still, and that single squared value then gets spread across all 21 observations before the square root shrinks it again.
Be precise about what this dataset is, because it decides how far you can push the result. This is a cross-section of 21 assets on one session, not the track record of one portfolio across 21 sessions. The arithmetic is identical either way. The target is also set at zero rather than at a funding cost or a Treasury bill yield, so read these as the Sharpe form and the Sortino form rather than as published performance figures. The behaviour they demonstrate holds regardless.
Why Does Deleting Your Best Day Improve Your Sharpe Ratio?
This is the result that settles the argument, and it's arithmetic rather than assertion. Take ARB's +34.45% out of the set. It was the largest gain on the board by a distance, so removing it ought to make the remaining picture look worse.
|
Return set
|
Mean
|
Standard deviation
|
Downside deviation
|
Sharpe form
|
Sortino form
|
|
All 21 assets
|
+4.7524%
|
7.3885
|
0.3033
|
0.643
|
15.668
|
|
20 assets, ARB removed
|
+3.2675%
|
3.3193
|
0.3108
|
0.984
|
10.513
|
Deleting the single best performer made the Sharpe form better and the Sortino form worse.
That inversion is the case for the metric in one line. ARB's outsized gain pulled the mean up by roughly 1.5 points, but it pushed standard deviation up by more than four, so on net it dragged the Sharpe score down. Losing it cost the numerator less than it saved the denominator. Sortino saw the mean fall while downside deviation barely moved, because ARB never contributed to downside deviation in the first place. If you're ranking traders or strategies and your metric rewards you for cutting your winners out of the sample, it's answering a question you never asked. There's background on Arbitrum and the ARB token if the ticker is new to you, and CoinGecko's ARB market page carries an independent close for the same session.
Risks of Trusting a High Sortino Ratio
15.668 is a very large number and it means far less than it looks like it means. The set contained exactly one losing observation. Change that one asset and the ratio moves violently, because the whole denominator rests on it.
Picture a restaurant with 21 reviews, 20 of them glowing and one bad. You know the average is good. You have no idea how bad the kitchen gets on a bad night, because you've seen one bad night. Downside deviation has the same problem. It's an estimate of how deep your losses go, built only from the losses in your sample, and one loss is not a sample.
Low sample counts break it. The fewer losing periods a series contains, the smaller and less stable the divisor becomes. A strategy with zero losing periods has a downside deviation of zero and a Sortino ratio that is mathematically undefined, and any tool showing you a number there has quietly substituted something.
Short windows flatter trend followers. Measure any long-biased strategy across a stretch that trended one way and it'll show few losses and a spectacular score. That figure describes the window, not the strategy.
It says nothing about how the losses were sequenced. Ten scattered small losses and ten consecutive small losses produce the same downside deviation. Only one of those two paths liquidates a leveraged position, which is why anyone trading perpetual futures should pair the ratio with a maximum drawdown figure rather than reading it alone.
Comparability is narrow. Two Sortino ratios rank against each other only when they share a target, a period length and a roughly similar sample size. Most published figures state none of the three.
How Should You Use the Sortino Ratio on Your Own Trades?
Start by setting the target honestly. Zero is the common default and it means you're asking how often and how badly you finished a period underwater. A funding cost or a Treasury yield is stricter and more informative for a leveraged book. Pick one and keep it fixed, because moving the target between comparisons invalidates both.
Then insist on sample size. As a working floor, want at least 30 losing periods before you take a figure seriously. On daily data, for a strategy that loses on 40% of days, that's roughly three months of trading. Below it you're measuring noise.
Use it alongside a volatility measure rather than instead of one. An asset's historical volatility tells you the size of the swings you'll be sitting through. The Sortino ratio tells you how much of that swing size was the kind that costs money. BTC is the useful reference point here, because its swing profile is the one most traders already carry in their heads, and bitcoin volatility is the best-documented series in the asset class. On 5 September BTC produced +0.21%, a return that barely registers in either denominator, and CoinGecko's BTC market page confirms that close independently.
And when someone shows you a Sortino ratio above 5, ask two questions before anything else. How many losing periods went into it, and over what window. If the answer to the first is under 30, you've been handed a number rather than a result.
Frequently Asked Questions
Is a higher Sortino ratio always better?
No. The figure rises as losing periods get rarer or shallower, so an unusually high reading usually signals a small or lucky sample rather than a superior strategy. Two ratios rank against each other only when they share a target, a period length and a comparable number of observations.
What target should I set for the Sortino ratio?
Zero is the standard default and the easiest to explain, since it asks how often you finished a period in the red. Traders running leveraged positions often use their funding cost instead, which is stricter and more relevant, because a position returning less than its carry is losing money in real terms.
How many periods do I need before the ratio means anything?
Aim for at least 30 losing periods, not 30 periods in total. The denominator is estimated only from the losses, so a two-year series with four losing days is still a four-observation estimate of your downside.
Can the Sortino ratio be negative?
Yes, and it happens more often than people expect. If your mean return falls below the target, the numerator goes negative while the denominator stays positive, and the ratio follows. A negative reading tells you the strategy lost money against its benchmark, though it says little useful about the distance between two negative readings.
Bottom Line
The Sortino ratio is the right default for anything with a skewed return profile, and the 5 September board shows why in one line: removing the best performer improved the Sharpe score. A metric that rewards you for deleting your winners will steer you toward strategies that never have big days. Use Sortino as the ranking number. Set the target at zero or at your funding cost and never move it mid-comparison, and refuse to act on any figure built on fewer than 30 losing periods. Then pair it with maximum drawdown, because a ratio that ignores the order your losses arrived in will never tell you which strategy blows up first.
This article is for informational purposes only and does not constitute financial or investment advice. Cryptocurrency trading involves substantial risk. Always conduct your own research before making trading decisions.
