Spot Bitcoin ETFs have now logged nine consecutive trading days of net inflows, pulling in roughly $2.7 billion across the streak. May 1 alone saw $629 million land in the funds, one of the strongest single-day prints of 2026. BTC is trading near $82,000, up 5.4% over five days, and ETH just cleared $2,400 with its own ETF flow tailwind.
The streak is dominated by BlackRock's IBIT and Fidelity's FBTC, the two products that have done most of the heavy lifting since the spot ETFs launched. April closed +$1.97 billion net positive, the strongest monthly total of 2026, and May is running positive out of the gate. The bigger story is what these flows mean mechanically. ETF inflows are not "buying pressure" in the loose sense most traders use the term. They translate directly into BTC removed from circulating spot supply, and that is the part of the equation worth understanding before you act on flow data.
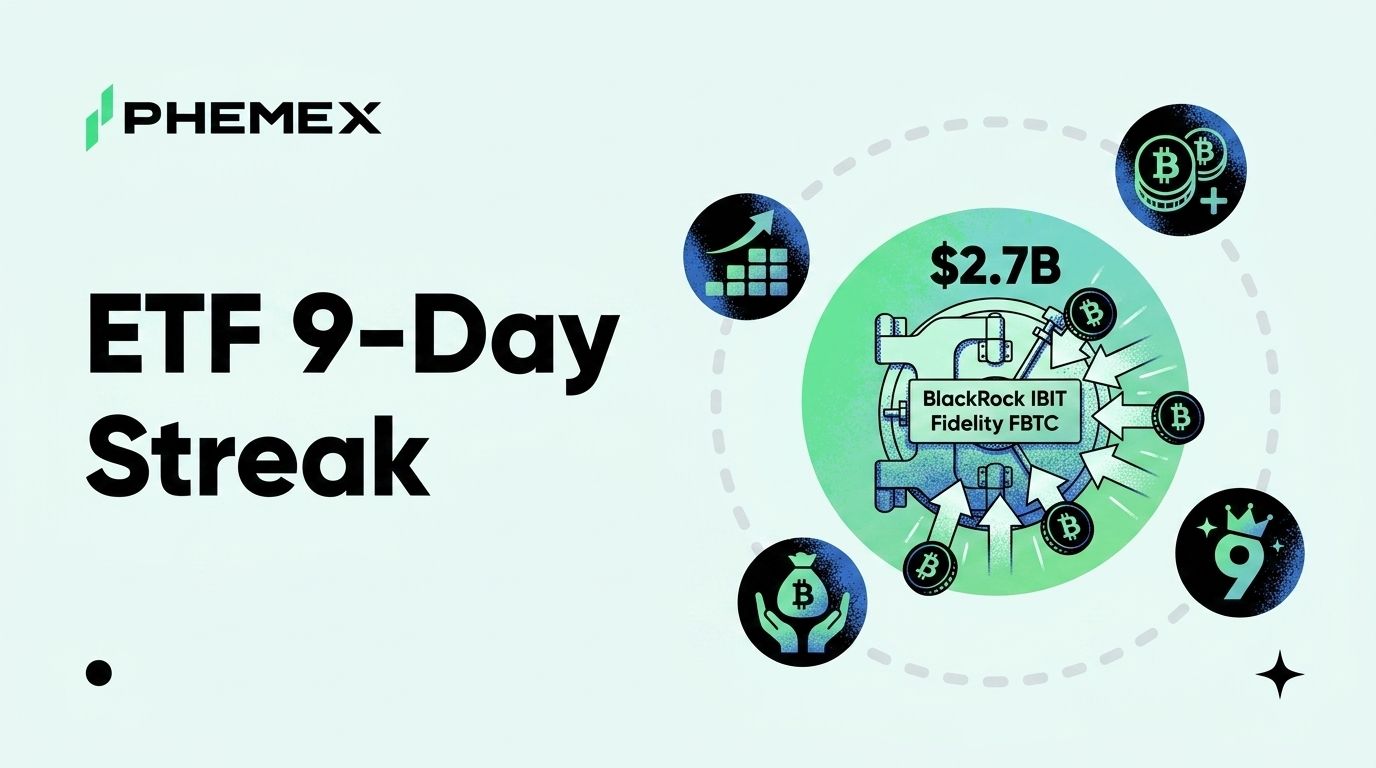
What the Nine-Day Streak Actually Looks Like
The streak runs through early May 2026 and totals approximately $2.7 billion in cumulative net inflows over three weeks of trading days. May 1 was the standout session at +$629 million, while May 4 added another $532 million with BlackRock's IBIT pulling $335 million and Fidelity's FBTC adding $185 million on its own. The other nine US-listed spot Bitcoin ETFs combined contributed the rest, mostly in single-digit or low double-digit million-dollar increments.
This is the second consecutive monthly net-positive month. April finished +$1.97 billion, the strongest monthly total of 2026 and a sharp reversal from the Q1 stretch where outflows dominated. May is currently running positive and on pace to extend the trend if the streak holds.
For context on scale, total cumulative inflows since the spot ETFs launched in January 2024 now sit above $60 billion. IBIT alone holds roughly 810,000 BTC, worth approximately $66 billion at current prices. The product is now larger by AUM than most of BlackRock's gold and emerging-market ETFs combined.
Why IBIT and FBTC Are Doing All the Work
The 11 US-listed spot Bitcoin ETFs are not equal. BlackRock and Fidelity have captured roughly 80% of cumulative inflows since launch, and that concentration has only deepened in 2026. During the April surge, IBIT alone captured about 70% of the $2.44 billion in net inflows, leaving the other ten products to share what was left.
There are three reasons for this. BlackRock and Fidelity are the two biggest asset managers most institutional buyers already use, so opening an allocation to their Bitcoin ETF is an internal paperwork shuffle rather than a new vendor approval. IBIT charges 0.25% annually, which is cheap relative to most actively managed products and competitive with the rest of the spot ETF lineup. And IBIT's daily trading volume now sits between $16 billion and $18 billion, which makes execution costs lower for any large allocator moving size.
The flip side: when flows turn negative, the same concentration cuts the other way. A bad week for IBIT is a bad week for the entire ETF complex. Watching IBIT's daily flow number tells you most of what you need to know about institutional sentiment on a given day, and it is why the product has effectively become the proxy for the asset class.
How ETF Inflows Actually Work (And Why It Matters)
Most traders treat "$629 million ETF inflow" as if it means $629 million of buy orders hit the spot market. That is not quite right, and the actual mechanism matters for understanding how flow data translates into price.
Spot Bitcoin ETFs operate through Authorized Participants, which are a small group of large brokerage firms (Jane Street, Virtu, Cantor Fitzgerald, and a handful of others) authorized to create and redeem ETF shares. When demand for an ETF outstrips supply during the trading day, the AP creates new shares by delivering BTC to the ETF issuer. The issuer then issues fresh shares to the AP, which sells them in the secondary market to the buyers driving the demand.
The net effect: every dollar of net inflow is collateralized by actual Bitcoin moving into the ETF's custody (Coinbase Custody for most issuers). When you see "+$629 million net inflows," what physically happened is the APs sourced approximately 7,800 BTC at an $80,000 average price and handed it to the issuers, where it now sits locked away from the freely tradable spot supply.
That is why ETF flows have become arguably the most important price signal of 2026. Spot exchange volume tells you what active traders are doing with Bitcoin they already hold. ETF flows tell you how much new Bitcoin is being pulled out of circulation by buyers who, by structure, almost never sell. The flow mechanics are explained in more depth here.
ETH and SOL ETFs Are Quietly Following the Same Path
The Bitcoin ETF story is no longer the only flow story. Ethereum spot ETFs have also been net positive in recent weeks, helping push ETH back above $2,400 after months of underperformance. The scale is smaller (ETH ETF AUM is roughly 10% of the BTC ETF complex) but the directional signal is the same. Institutional allocators are layering ETH exposure onto existing BTC positions rather than rotating between them.
SOL ETFs are newer and the data is thinner, but early flow numbers have been positive. Solana spot ETFs launched in early 2026 after the SEC/CFTC commodity classification cleared the regulatory path, and inflows have been small but consistent. The pattern across all three products tells you something specific about how institutions actually allocate. They build positions slowly, in size, and across multiple assets simultaneously. They do not chase rallies, and they rarely sell into them.
Flow-by-Flow: What the Last Three Weeks Looked Like
|
Date range
|
Net flow
|
Driver
|
|
Late April (8-day streak)
|
+$2.1 billion
|
IBIT $1.4B, FBTC remainder, BTC $68K to $77K
|
|
April monthly total
|
+$1.97 billion
|
Strongest month of 2026, sharp reversal from Q1
|
|
May 1 single day
|
+$629 million
|
One of strongest single-day prints of 2026
|
|
May 4 single day
|
+$532 million
|
IBIT $335M, FBTC $185M
|
|
May 5 estimate
|
+flat to positive
|
Streak extends, BTC holds $82K
|
|
Cumulative May (running)
|
Positive
|
Pace suggests another $2B+ month if held
|
The takeaway from the table is the consistency, not the magnitude of any single print. Nine consecutive days of net inflows has only happened a handful of times since the spot ETFs launched, and the previous instances have generally preceded extended price moves rather than coincided with them.
Why This Matters Right Now
BTC at $82,000 is up 5.4% over the past five days, and the CoinDesk daybook from May 4 flagged the combination of stalling spot price and continued ETF demand as the setup that historically precedes breakouts rather than breakdowns. The flow data is constructive even when price action is choppy.
The deeper point is that 2026 has been the year ETF flows decoupled from short-term spot volatility. During Q1, BTC bounced between $66,000 and $80,000 multiple times while ETF flows alternated between net inflows and outflows on weekly timeframes. April was the inflection. Once the streak started building in mid-April, the flow data started leading the spot price rather than following it. That recovery in flows is real but not yet complete, and the question for May is simple. Does the trend extend, or does profit-taking pull the streak back to neutral?
For traders, the practical implication is that ETF flow data has earned a top-three slot in any serious daily macro check, alongside BTC dominance and stablecoin supply. The most reliable real-time sources are Bitbo's ETF flow tracker, Farside Investors, The Block's spot Bitcoin ETF dashboard, and CoinGlass. All four refresh daily after market close and show the IBIT and FBTC splits explicitly.
What Could Break the Streak
The pattern that has historically ended ETF inflow streaks is rarely an exogenous shock. It is usually a combination of three things converging at once: BTC reaching a local high that triggers profit-taking, a macro data print that reprices Fed cut expectations, and a single bad day at IBIT that the rest of the complex cannot offset.
Of those, the IBIT-specific risk is the most underweighted. Because IBIT is so dominant, a $400 million outflow day at IBIT alone can flip the entire ETF complex negative even if every other product is net positive. That has happened a handful of times since launch, and each instance produced a multi-day correction in BTC spot price.
The other risk worth tracking is options expiry. Large monthly and quarterly options expiries have historically produced flow volatility in the days before and after, as ETF holders adjust hedges. The next major expiry is the May 30 monthly, which falls inside the window where this streak would either confirm a sustained trend or roll over.
Frequently Asked Questions
Are Bitcoin ETF inflows the same as spot buying?
Not exactly, but functionally close. ETF inflows are settled by Authorized Participants who must source actual BTC and deliver it to the issuer to create new shares. So every dollar of net inflow corresponds to roughly the equivalent dollar of BTC being acquired and locked in custody, where it is unlikely to return to circulation for years.
Why does BlackRock's IBIT dominate the flow data?
BlackRock is the largest asset manager in the world, so most institutional allocators already have IBIT on their approved-product list with no additional vetting required. The 0.25% expense ratio is competitive, and IBIT's $16-18 billion daily trading volume makes execution cheap at scale. That combination has produced a self-reinforcing concentration where roughly 70% of monthly inflows go to one product.
How big is $2.7 billion in inflows compared to total Bitcoin daily volume?
Bitcoin's global daily spot volume runs $20-40 billion on a normal day, so $2.7 billion across nine sessions averages about $300 million per day, or roughly 1-2% of daily volume. The size sounds small relative to total volume but is meaningful because ETF buying is incremental new demand sourced from outside the existing crypto-native trader base, while most spot volume is recycling between existing holders.
Does an ETF inflow streak guarantee BTC goes up?
No, and treating any single signal as a guaranteed setup is how traders get hurt. The flow-to-price relationship is statistical, not deterministic. The historical pattern shows that extended inflow streaks (seven days or more) precede positive BTC returns about 75% of the time over the following two to four weeks, but exceptions exist, especially when macro conditions are deteriorating in parallel.
Bottom Line
Nine consecutive days of net Bitcoin ETF inflows totaling $2.7 billion through early May, with IBIT and FBTC doing the bulk of the work and April closing as the strongest monthly net total of 2026. The mechanical reality of those flows is that roughly 33,000 to 35,000 BTC has been removed from the freely tradable spot supply over the past three weeks, locked into ETF custody where it functionally does not come back.
The signal to watch from here is IBIT's daily flow holding positive through the May 30 options expiry. If it does, the streak extends and the second consecutive net-positive month confirms the pattern that started in April. If IBIT prints a single $300M+ outflow day before then, the streak likely breaks and the spot price probably tests $78,000-$80,000 as the first support. Flow data has been the dominant macro variable for crypto in 2026, and that is unlikely to change before either the Fed pivots or the spot ETF complex finds its first real test.
This article is for informational purposes only and does not constitute financial or investment advice. Cryptocurrency trading involves substantial risk. Always conduct your own research before making trading decisions.