
Stochastic RSI vs RSI Indicator
The Stochastic RSI trading strategy provides a stochastic calculation of the RSI of an asset. Still, it measures the RSI relative to its low and high range within a specific period. Though both indicators look alike, they are different from one another. For example, while StochRSI works on the assumption that prices tend to move closer to their highs during uptrends, the RSI oscillator assumes that prices show a natural tendency to close far from a mean position before retracting. Although each indicator aims to help traders find oversold/overbought conditions, they yield different results. StochRSI indicates when the price of an asset moves to the highest or lowest point of a range. On the other hand, RSI helps to find when the asset’s price is moving too quickly.
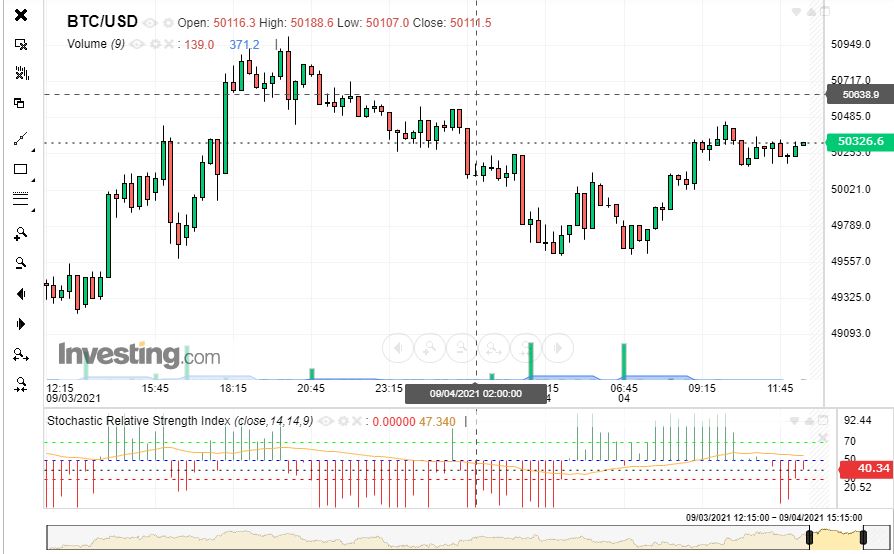
Here is an example of Bitcoin Stochastic RSI for 14 days (Source: Investing)
How Does Stochastic RSI Work?
Founders of Stochastic RSI, suggested traders set oversold/overbought levels at 20/80 instead of the 70/30 often used for RSI. As per the guidelines:
1) A trader should go long when StochRSI falls anywhere below the Oversold level and then recovers above it.
2) A trader should go short when StochRSI increases above the Oversold level and then crosses below it.
If these points tell us anything, a Stochastic RSI buy signal is generated when the oscillator advances from the Oversold level to above 20. At the same time, the Stochastic RSI indicates a sell signal when it declines from the Overbought level to below 80. When the StochRSI level is in the middle (50), the market moves sideways due to a condition called Stochastic RSI crossover, wherein the asset price remains constant as long as this level is maintained.

However, like other oscillators, Stochastic RSI can also remain oversold or overbought for a long time. In such periods, oversold doesn’t necessarily mean the price will reverse higher, just like overbought doesn’t mean the price will go lower. Instead, these signals indicate that the RSI is close to the extremes of recent readings.
How to use StochRSI for Intraday Trading?
Instead of using the default settings for intraday trading, a trader can change and apply the best stochastic settings on a 15 minute chart.
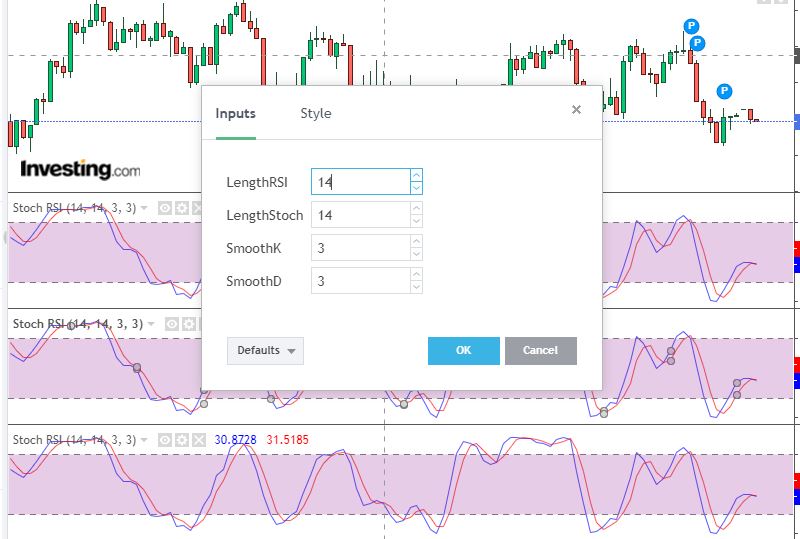
Source: investing.com
Traders can select a specific period for the RSI and the % K or %D to understand divergences and make decisions accordingly. Also, they can adjust entry points to gain a deeper market understanding.
Though it is difficult to use Stochastic RSI for intraday or day trading, traders with quick decision-making, the right skill set, and the best reflexes to react can utilize it to make informed decisions.
What is %K and %D in Stochastic RSI?
%K and %D are variables in the Stochastic RSI oscillator, represented by two lines. %K (blue) line represents the number of RSI periods used in calculating Stochastic. %D (red) line is a signal line represents the moving average of %K.
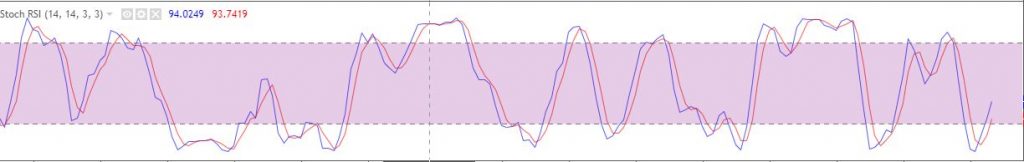
A trader with expertise in evaluating divergences between the indicator and the asset price can use StochRSI RSI divergence (%K or %D) to make better investment decisions.
How to Set Up and Calculate Stochastic RSI?
As discussed above, Stochastic RSI includes a default setting of the overbought level at 80 and the oversold level at 20. But, a trader can change these settings as per preference. Once applied, use the following Stochastic RSI calculation formula to calculate the oscillator:
Stochastic RSI Calculation
Let’s consider X as the number of periods. On most platforms, X represents 14 periods by default.
RSI = Current RSI Reading
Lowes RSI = Lowest RSI in last X periods
Highest RSI = Highest RSI in last X periods.

Steps to Calculate Stochastic RSI
- Calculate the RSI for a selected period of time of a data series.
- Now, subtract the minimum RSI value for the selected period from the recent RSI value.
- Again, subtract the minimum value for the selected period from the highest RSI value.
- Apply the Stochastic RSI formula to get the result.
Conclusion
A trading strategy works best when you know your trading style. A trader looking for advanced signals can use the Stochastic RSI oscillator to find where the price trend of an asset might end. It can be used in different ways, like oversold/overbought levels, bull/bear trade setups, and divergences. However, like all indicators, the successful implementation of Stochastic RSI requires a disciplined approach.
 Register to get $180 Welcome Bonus!


