Summary
- Linear regression is a mathematical equation used to predict the relationship between two assets such as Bitcoin and USD. Linear regression indicators are predictive and can help traders determine price trends and the duration of the trends. The “S Linear Regression Curve” and the “Linear Regression Slope” are the two most popular regression indicators.
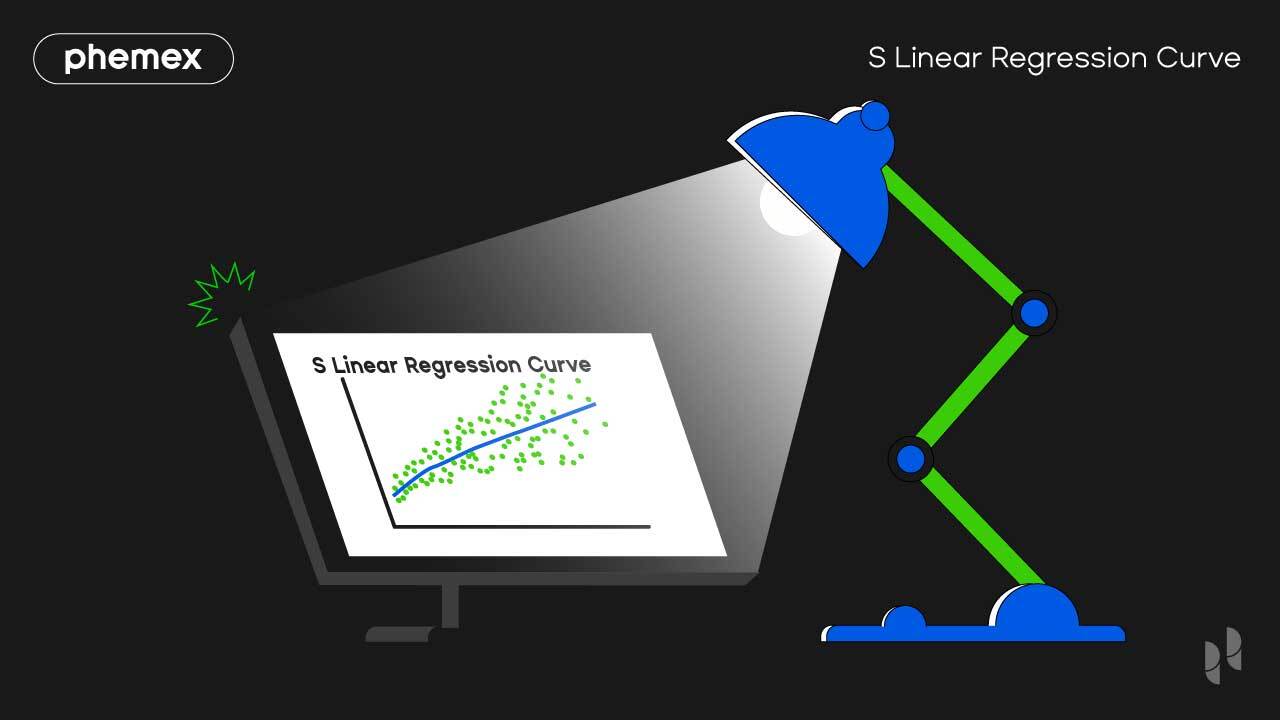
- The “S” in “Linear Regression Curve” stands for “simple”. The Simple Linear Regression indicator is akin to a moving average indicator and trails as a single line on the chart candles. It generates buy signals when the line oscillates above the Bitcoin candles, and generates sell signals when the line oscillates above the candles.
- The “Slope” in “Linear Regression Slope” is a metaphor for a surface in which one end is higher than another. The indicator slopes above or below a mean value based on the current trend; it predicts a possible future direction for Bitcoin and measures the current trend strength.
What Is S Linear Regression Curve?
The S Linear Regression Curve is a regression curve that operates akin to a moving average (MA) indicator. The indicator envelops the Bitcoin candles and estimates a “fair value” for the price at a given moment. If the price is trending below the curve it’s considered a buy signal. If the price is trending above the curve it’s considered a sell signal.
What Is Linear Regression Slope?
The Linear Regression Slope is an advanced momentum oscillator that trends in positive and negative territory. If the oscillator is trending above the mean slope, Bitcoin is in a positive trend. The trend strength varies based on how far extended it is above the mean value. Both the regression slope and the S linear regression curve can be used in conjunction for trend trading.
Regression is used for predictive analytics For example, if a store has increased sales every month for a year they can use the formula to calculate future sales increases.
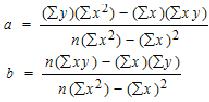
The Linear Regression formula is as follows:
The linear regression equation was invented in 19th century England by Sir Francis Galton, one of the most well-known Victorian era mathematicians. The first Linear Regression trading indicator was invented by Gilbert Raff in the 90s. Raff introduced the Linear Regression forecast indicator in his book “Trading the Regression Channel” in 1996. It was first adopted by stock traders and later used in the crypto industry. There are over a dozen linear regression-based indicators but the Slope and the Curve indicators are the most well-known.

Linear Regression Slope Formula
The Linear Regression slope formula is based on two variables. Linear regression indicator variables are known as “trading pairs” in the crypto industry. If we take Bitcoin as the first variable, we can assign it a second variable in USD or a stablecoin such as Tether (USDT). These two variables use the equation Y = a + bX.
If Bitcoin is the “A” variable, and USDT is the “B” variable, then “X” is the n-period of the USDT variable. Once the value of Bitcoin fluctuates in USDT, the slope is created. As the indicator gathers historic data, it records all the fluctuations and predicts a possible future trend line.
The indicator calculation multiplies the slope value times 100 and then divides it by the current price. The slope on the Linear Regression Slope derives data from historic n-1 bar periods. The default period value is 14. If we’re using it on the daily chart, the slope will curve based on the average value for the last 14-day periods.
Linear Regression Curve Formula
The Linear Regression Curve formula is based on the same Y = a + bX formula as the regression slope, but it’s smoothened differently. The simple Linear Regression Curve indicator resembles a moving average indicator. Despite that, their output is highly different.
Moving average indicators such as the Moving Average Convergence Divergence (MACD) use closing prices for the day (00:00 UTC) over a certain period. The linear regression curve calculates the data using a regression line between two specific dates, and then merges the results. A trader can manually adjust the dates over the n-periods they need.
The result is considered a fair value for the asset at the present moment. If Bitcoin is trading above the fair value on the regression curve, we can short it until it reaches that value. If it’s trading below the fair value on the regression curve, we can long it.

How to Use Linear Regression Indicators?
The two linear regression indicators available on Phemex are “Linear Regression Curve” and “Linear Regression Slope”.
- To get started, select a trading pair such as BTC/USDT:
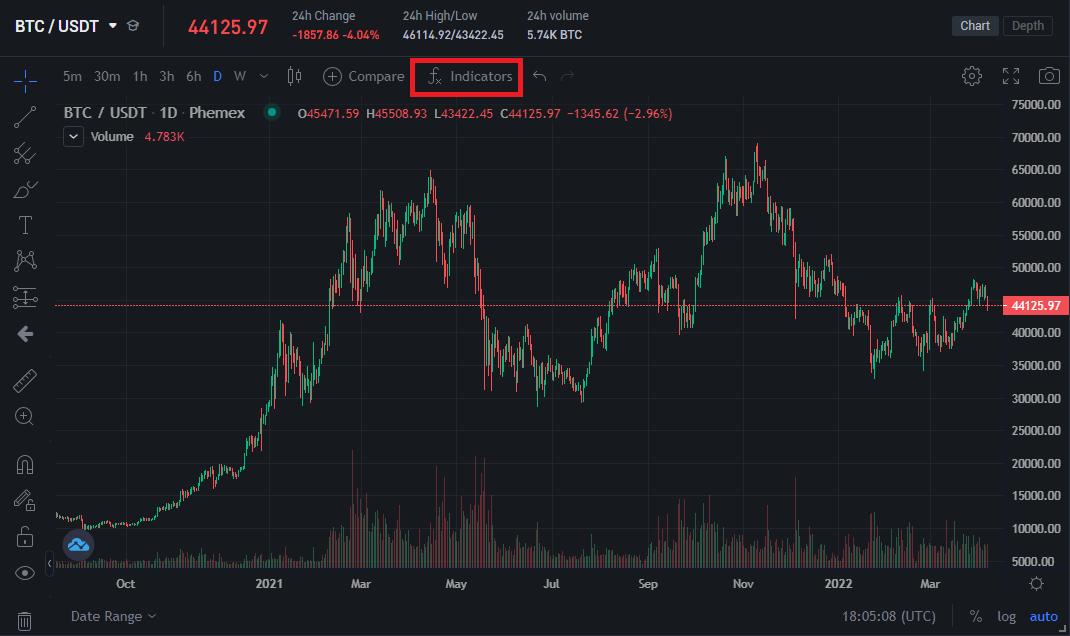 The Bitcoin chart is the highest-volume chart on Phemex.
 - Click on “Indicators” at the top and search for “Linear Regression”. The two indicators will appear:
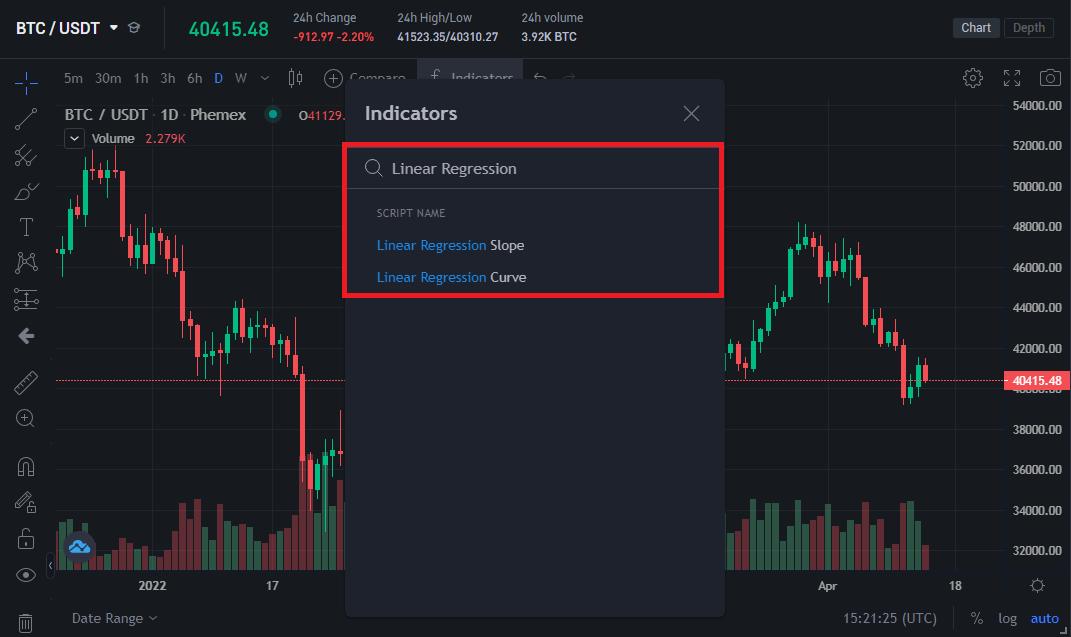 Use the search bar to locate all available indicators.
 - Left-click on both and they will load simultaneously underneath the Bitcoin chart:
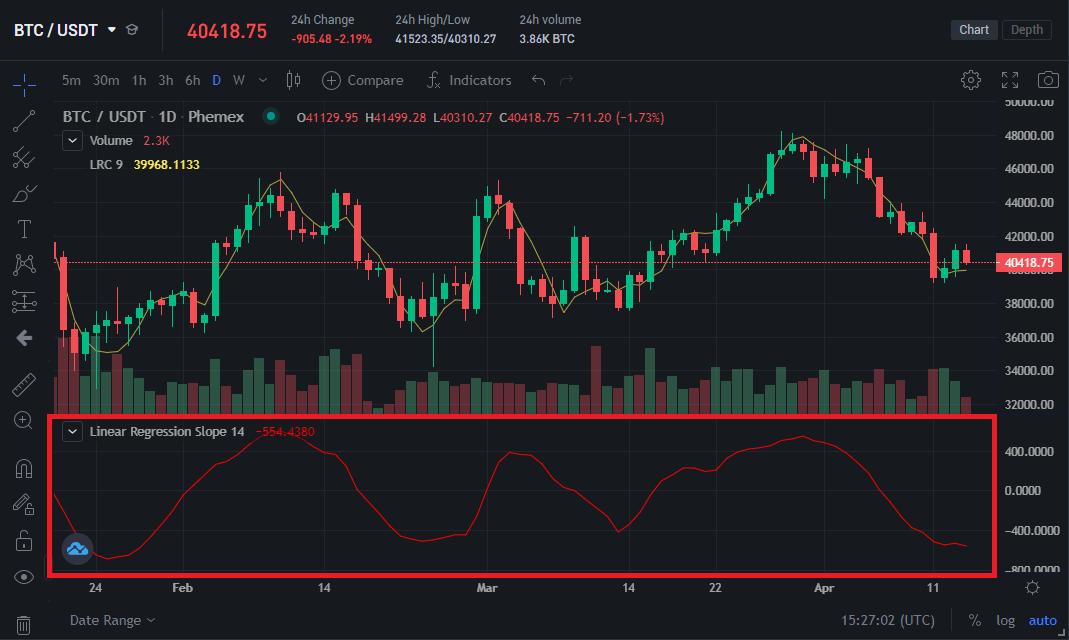 Linear Regression Curve (yellow line) and Linear Regression Slope (red line).
 - The Linear Regression “Slope” indicator is active underneath the candles, while the Linear Regression “Curve” indicator is the line trailing the Bitcoin candles. Both indicators can be used to create a linear regression based intraday trading system.
How to Trade With The Linear Regression Slope?
The Linear Regression forecast indicator is an oscillator that identifies trend strength for Bitcoin, indicating if we’re in a bullish or a bearish trend. An effective Linear Regression Slope trading strategy is to wait until Bitcoin reaches support and resistance levels:
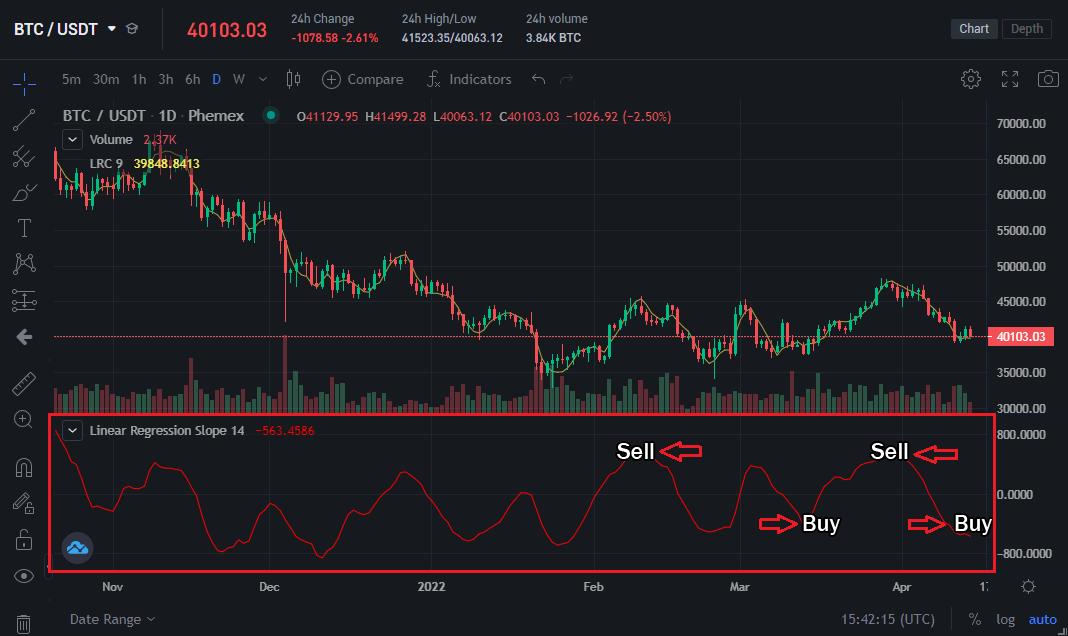
The upper and lower barriers provide trading signals.
A trader could sell when Bitcoin is hitting the upper barriers of the regression slope, and buy when it’s hitting the lower barriers of the slope – i.e. historic support levels. The current chart shows a long opportunity as Bitcoin is nearing historic support levels where it bounced in the past.
Defensive traders can wait until a trend reaches the mean value of zero. If Bitcoin is in an uptrend from the bottom and reaches the middle of the simple linear regression slope, we can expect it to continue on the uptrend until it peaks and reverses.
How to Trade With The Linear Regression Curve?
The linear regression curve indicator presents unique data that may be missing from moving average indicators. An effective linear regression curve trading strategy is to wait until the curve moves above the Bitcoin candles to open a short trade, or below to open a long trade.
The Linear Regression Curve is most effective over a long-term chart such as a weekly chart. If we switch to the 1W (weekly) chart, we can see how Bitcoin performed historically with the regression curve:
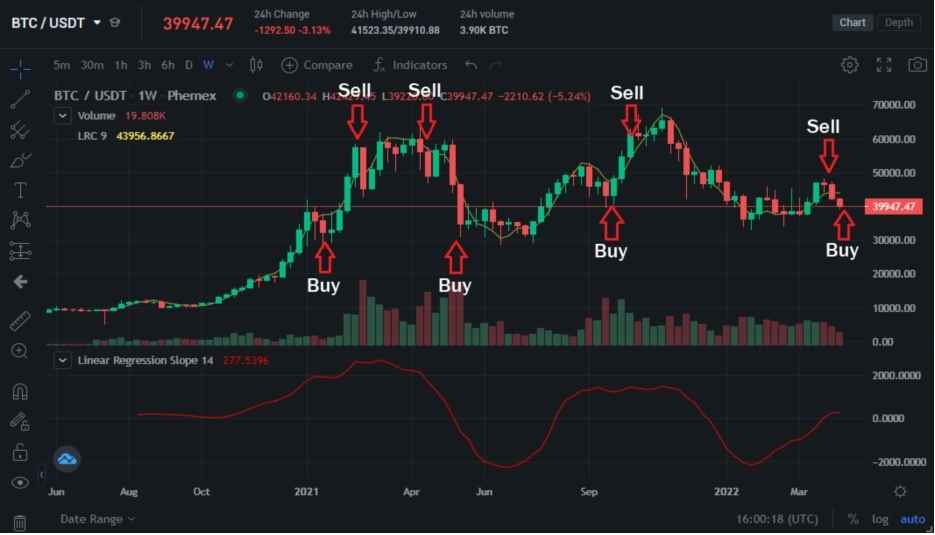
Buy signal: When Bitcoin trades below the line. Sell signal: When Bitcoin trades above the line.
Bitcoin fell below the regression curve at the start of the 2021 bull run, but quickly recovered and went above the curve twice. During the May 2021 crypto crash, Bitcoin wicked below the curve multiple times. It traded above the curve in November 2021 when it made a new all-time high of $69,000.
At the moment, Bitcoin is trading below the regression curve which indicates a great buying opportunity on the weekly chart. It briefly traded above the regression curve and depreciated, which validates the accuracy of the indicator.
How to Trade Linear Regression Channels?
Channel trading is used to identify support and resistance levels. Support levels are areas in which more people are buying while resistance levels are areas where more people are selling or waiting for a dip opportunity. The linear regression channel trading strategy involves drawing support and resistance lines on the linear regression curve.
Indicators such as Bollinger Bands automatically calculate support and resistance levels with the linear regression curve. We can use Bollinger Bands in conjunction with linear regression to check if the “fair price” on the curve is aligned with current support and resistance levels:
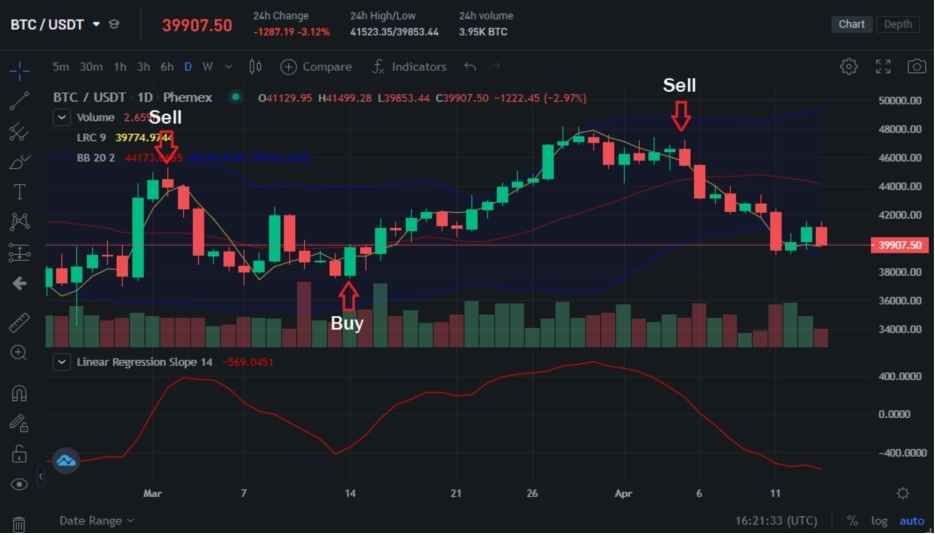
Bollinger Bands: Two blue bands. Regression Curve: Yellow line.
The Bollinger Bands also have a mean value displayed as a red line. Traders can wait until Bitcoin goes below the red line to buy and above the red line to sell. Ideally, we can wait until Bitcoin is below the regression curve and the red line on the Bollinger Bands to open a long trade.
At the time of writing, the Bollinger Bands indicate that Bitcoin is trading near support levels, but that it could go lower. The linear regression curve also indicates that Bitcoin is trading above the curve on the daily chart, which indicates the price may go down temporarily in the near future.

Conclusion
The two most popular Linear Regression indicators are the curve and the slope. A smart trader can use both to get context about Bitcoin and the direction it’s going in to optimize their trades. The Slope indicator is a momentum oscillator, but it is not range-bound. It’s mostly for trend trading and measuring the strength of a trend.
The curve indicator may appear similar to moving average indicators, but it will output highly different values. It has historically proven to be one of the most accurate indicators for long-term trading. Using it on the weekly or monthly charts can tell traders the best entry points for Bitcoin.
Traders that bet on price reversals will benefit from the slope indicator because Bitcoin often reverses when it hits the upper or lower boundaries of the indicator. Traders who buy and hold Bitcoin for the long term can use the curve indicator to Dollar Cost Average (DCA) and strategically invest their capital.
 Register to get $180 Welcome Bonus!


